We have charted the data of all participants of the yDNA Project, comparing their results in several ways to create an overall picture, where it is feasible, of their relationships to each other and to identified lineages.
The Family Tree DNA website (www.familytreedna.com) provides a Tutorial, Glossary and a number of links and sources for participants to read through to gain an understanding of the significance of the raw data which is derived from the testing that is done to the samples provided by the participants. Rather than attempt a ‘DNA 101′ here, we recommend that all interested individuals browse through the Family Tree website, which is accessible to everyone, even if you haven’t joined the Project yet yourself. If you have individual questions after you have availed of their information, we will try to assist you, or go to Family Tree to find the answers.
DNA Basics
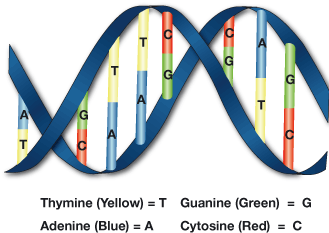
In order to understand the terminology used, we will give you a very general overview of the process here, with the help of graphics from Family Tree:
DNA is made up of four base compounds: Adenine (A), Cytosine (C), Thymine (T), and Guanine (G). The order of these bases is called the DNA sequence.

There are a large number of markers, or loci, on the Y chromosome which contain varying sequences of these bases. As each marker/locus is identified, it is given a DYS# (D = DNA: Y = Y-Chromosome; S = Segment), and the STR (Short Tandem Repeat) of the bases at each marker/locus (for example, ATGC ATGC ATGC ATGC) are counted to determine the allele/numeric value of those repeats for each marker tested for an individual. Family Tree provided tests of 12, 25, 37, 67 or 111 markers.
Each individual has his own haplotype (set of alleles/values). Individuals who are related will have the same alleles in their haplotype. However, mutations can occur over time; and the further the distance of relation, the more likely one or more of the markers may have mutated, for example, moving up one from an allele value of 12 to 13 or down one to 11. Markers can also back mutate to a previously held value in the genetic past of the line. Some markers are very stable and change very infrequently. The faster mutating markers are shown in a maroon background in the Results Spreadsheet at the Family Tree website. If there are differences between individuals in allele values in the faster mutating markers, opposed to the slower moving markers, there is a greater likelihood of a more recent common ancestor.
Each person also belongs to a haplogroup, which is a group of similar haplotypes that share a common ancestor, identified by an SNP (Singular Nuclear Polymorphism). Family Tree are often able to predict a person’s haplogroup (groups of haplotypes with similar alleles) based on their haplotype. Almost all of the Project participants are either predicted or confirmed to be in the R1b haplogroup. This is the single largest haplogroup in the world, located most densely in Western Europe. There is an established Atlantic Modal Haplotype – AMH – which identifies the most common alleles at the different markers for the R1b peoples populating the Atlantic coast, including Iceland, Britain and Ireland. A major subclade amidst the AMH is defined by L21, an early SNP discovered, which still maintains the same modal as the AMH (although not all R1b1a have the L21 SNP). Subsequent sections on the Interpretations link will explain and discuss SNP’s further.
Matching Individuals
Due to the size of R1b, participants will often see matches to individuals of completely different names, even at 25 markers, which is indicative of the huge number of members of the R1b haplogroup. There can be numerous individuals who have many alleles in common but nevertheless do not have a common ancestor, except very distant, possibly many thousands of years ago. Family Tree explains this at their link on participants’ personal pages at their website under the heading ‘Understanding matches with different surnames’.
The Group Administrators have access to calculation tables to compare all of the participants to one another and estimate their TMRCA (Time to Most Recent Common Ancestor). The calculations determine the probability of how long ago the individuals had a common ancestor. This is based on the length of a generation to be 25 years. Family Tree has calculated the mutation rate of the markers (how often they change) and use those rates to compare where two individuals’ haplotypes differ. The number of generations is calculated with varying degrees of probability. We use a scale of 95% probability to maximize the potential for accuracy. However, not all genetic genealogists agree with Family Tree’s chosen mutation rates. There are a number of other individuals or groups who have developed their own mutation rates for the various markers, and while there is a degree of difference between each of them, their rates, combined with some using 30 years for a generation rather than 25 as Family Tree does, are usually longer than Family Tree’s. It is unfortunate that the genetic genealogical community as a whole has not been able to adopt a consistent set of rates for everyone to use, but it is indeed a difficult task for the statisticians to arrive at what can be considered accurate estimates which can be relevant to the past as well as the present when studying genetic histories.
A point to keep in mind is that all of these statistics are just probabilities. With an exact match at 37 markers, the Family Tree calculator predicts TMRCA within eight generations with 95% probability. We have a father/son pair in the Cavan Group A whose haplotypes match exactly at 37 markers. In this case, the distance is just one generation. However, two members of the Mór group also match at 37 markers exactly, yet their common ancestor (of which they were unaware until they researched their paper records upon finding their Y-DNA match) dates back to the early 1800’s and six generations back. In addition, Family Tree admits that the accuracy of their calculator diminishes the greater the genetic distance between individuals. This all puts into perspective the caution with which we need to approach comparing the results of individual tests. The numbers are a guide, but only that.
It’s possible that the connection to other members of the tribe to which a participant belongs is actually closer, or more distant, than the figures you will see in the TiP calculator found on the Matches page. There will never be a way to be sure beyond the information provided by a paper trail or family history you may have. For those of you who have close ties – less than 600 years distant – the odds are greater that you can rely more upon the accuracy of the statistics you see. For connections further back than that, it’s best to consider the dates a general indication of time of relatedness.
Results
The pages at the Family Tree website for The O’Donoghue Society contains the Results spreadsheet – see www.familytreedna.com/public/ODonoghue/.
These pages will provide the most current data results as they become available, including each participant’s individual haplotype in the spreadsheet for the markers that have been tested as well as the haplogroup to which they belong, the terminal SNP if tested and a map showing the location where the families originated for all of those who have entered that information on their personal pages.
The Historical Origins link, Historical Origins of the O’Donoghues – Odonoghue, and other areas of The Society website provide knowledge of the different tribes of O’Donoghues from ancient times. By studying the level of genetic match and comparison of common alleles amongst the various participants, along with their family origins when they know them, patterns emerge. They each have particular marker values which identify them as a group.
The Eóganacht have a long and detailed history in the Irish annals and various other papers and genealogies recording Ireland’s heritage. They are not all O’Donoghues, and some of them faded into insignificance long before surnames were adopted, so it’s difficult to know what their genetic legacy now may be. One thing that genetic genealogy has been able to clarify, accompanied by archaeological evidence and historical records, is that there does seem to be a correlation between almost all the family names who are traditionally associated with the Eoghanacht tribes of the early centuries AD, though not always what a historian might expect.
Aided by the historical pedigree of Geoffrey The O’Donoghue of the Glens, Chief of the Name of the Glens tribe, along with the strong family tradition of Tighe O’Donoghue/Ross descending from the Mór/Ross O’Donoghues and others with family records and history placing them in the territory of the Loch Léin O’Donoghues, we have been able to identify ancestral haplotypes within the two Kerry Eóganacht tribes. Overall, they are subdivided into several separate groups. There is a core group that match The Glens own haplotype and other groups who are varying distances from The Glens himself. This is to be expected, but their origins place them within The Glens tribe. In addition, there is a possible UíDhonnchadha of Ossory. This sept, related to the Cashel Eóganacht according to the annals, ruled the Osraige many centuries ago, and the two gentlemen, who are related relatively recently, in that subgroup have origins near the Osraige territory.
The Mór group includes several related clusters. While these three groups are not themselves related in a recent time frame, their family origins place them generally within the territory of the Mór and they are grouped accordingly.
The next major set of groups is the Cavan Donohoes. They have a number of different genetic groups amidst them, with each group indicating the identifiable haplotypes that unite them. Joe Donohoe, the Group Administrator (now deceased) of the Breifne Clans Project, researched a great deal of information which he provided in his annual reports, particularly the last one of July 2009. The reports are available in the pages of the Y-DNA Project link at The Society website as well.
We have tentatively classified a number of smaller groups of matching individuals, several who may correlate with other known O’Dongohue tribes.
There are some individuals whose haplotype is significantly different from any of the established tribal haplotypes we have identified. They are listed in the main results spreadsheet at Family Tree in the latter Clusters, including an ‘Unaffiliated’ section containing a group of so far unrelated individuals and the members who belong to other haplogroups, R1a and I.. Their alleles do not match any of these ancestral haplotypes closely enough, nor is their TMRCA close enough to other participants, to be able to identify the tribe to which they belong at this time. We await the addition of new participants to broaden our database and hopefully identify more of the O’Donoghue tribes
The concept of SNPs vs STRs and their relationships are discussed more fully on the Interpretations link, for those who are interested in delving deeper into the significance of the various haplotypes, modals, allele values and the interpretations we have made from this data in forming our classifications.
Updated July 2018
